As Communications Service Providers (CSPs) worldwide scale up the deployments of their 5G networks, they face strong pressure to optimize their Return on Investment (RoI), given the massive expenses they already incurred to acquire spectrum as well as the ongoing costs of infrastructure rollouts.

Acceleration in HW is Boosting Performance. In DPDK 17.02 rte_Flow is the Enabler.
Acceleration using HW has been available in DPDK for a while in form of FDIR (Flow Director, the former method for packet filtering/control), but FDIR is not generic which is why only a subset of the supported DPDK NICs are supporting it. Generic flow API, rte_flow, is one of the new features in DPDK 17.02 that in time will enable broader HW acceleration support.
I have been tracking the generic flow API via the DPDK mailing list for a while and Napatech has also already been using it internally, within our OVS HW acceleration project. I’m still learning DPDK so as part of my learning I decided to use rte_flow and some of the other DPDK library functions to build an inline bump-in-the-wire HW accelerated flow table and test the effect of HW acceleration.
Documentation
I already, before I fetched the 17.02 source from dpdk.org, read the RFC posted at the mailing list (https://dpdk.org/ml/archives/dev/2016-July/043365.html), so it wasn’t that big a deal to browse through the excellent rte_flow documentation at dpdk.org. The original documentation is now gone and there is a placeholder document saying that rte_flow is now part of DPDK 17.02.
The documentation has a API migration section and I hope that it will encourage people to start migrating towards the generic flow API instead of the prior methods.
testpmd
As part of the documentation of rte_flow the testpmd also has a whole section covering flow rules. It turns out that testpmd command prompt enable you to write flow rules directly from within testpmd via a flow syntax. The command line supports “tab completion” so my first thought was that testpmd would be a great tool to make some initial trials.
We have already before dpdk-17.02 made integrations with rte_flow from within the OVS acceleration Napatech is currently developing, but having a command line tool make it easier just to try out stuff.
testpmd flow syntax command line – the good and the bad
The command line flow syntax is very well documented with lots of examples, but once you start using the embedded examples you very quickly find that most of them doesn’t work and you are met with “bad arguments” or like shown below
testpmd> flow create 0 ingress pattern eth / ipv4 / udp / end actions queue index 6 / end

Caught error type 9 (specific pattern item): cause: 0x7f583fdad120, NULL IPv4 spec/mask
It’s too bad that the examples in the documentation doesn’t work because I find that the syntax within testpmd is really good if you want to try something out before hitting the editor and start writing loads of code just to find that it didn’t work as expected or the NIC you are interfacing to has limitations.
The rte_flow has no method where you can query what features of rte_flow is supported, you must trial-and-error and then trial-and-error something else etc. until you find what works and what doesn’t.
The only flow rules I could apply with success using testpmd was a full 5-tuple flow like the following:
testpmd > flow create 0 ingress pattern ipv4 src is 10.10.10.30 dst is 10.10.10.10 / tcp src is 50560 dst is 102 / end actions queue index 1 / mark id 1 / end

Flow rule #0 created
FlowTable application
https://github.com/napatech/dpdk/tree/v17.02-rte_flow
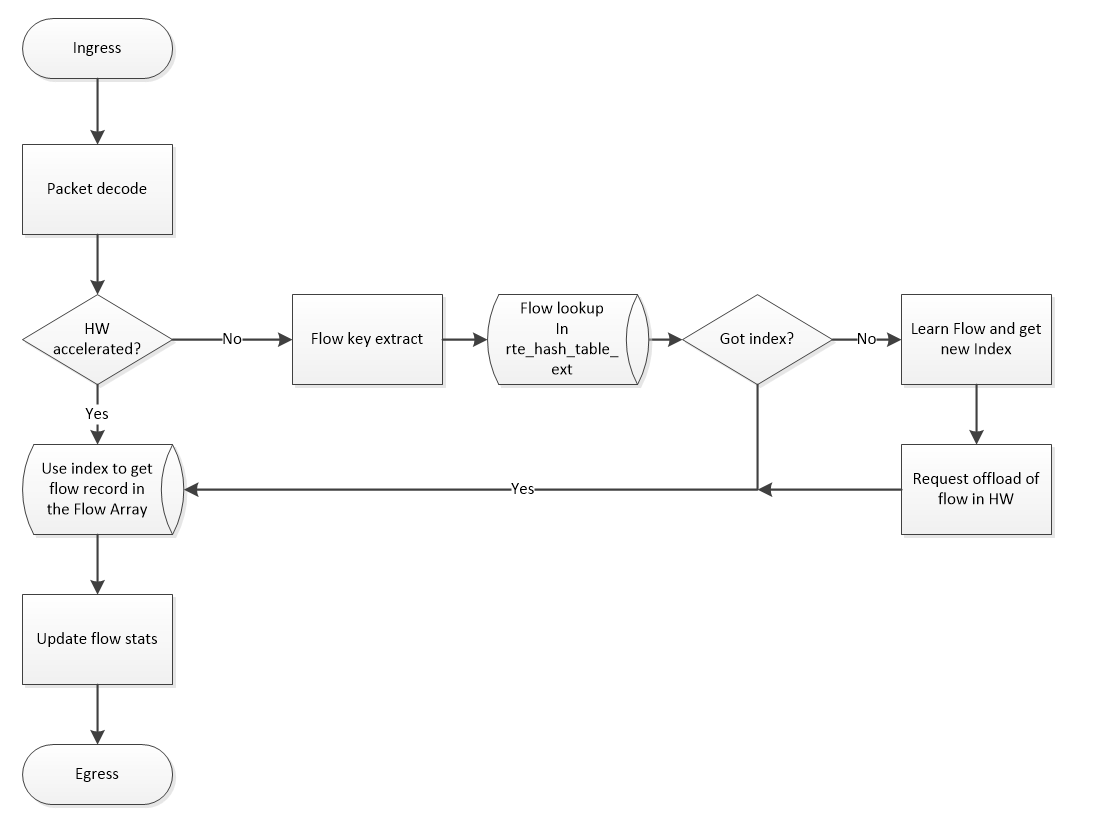
The flowtable application will for each packet perform a lookup and find a flow record.
The flow record contains flow statistics and state information and is the foundation to many higher level applications.
A flow lookup is done by extracting a flow key and perform a hash based lookup followed by a key compare because the hash could have collisions.
A flow table is different from a flow cache, a flow table needs to hold the flow until it terminates whereas a cache can old entries in case of collisions.
DPDK has rte_table_hash which is suited to create a flow table and is found in various implementations depending on the key and purpose. I use rte_table_hash_ext because my key is larger than what was supported by one of the hardcoded ones. The rte_table_hash perform a lookup and return an index to where the flow record is located within a flow stat array.
The HW acceleration is used to bypass the flow extract, hash calculation and table lookup because if the flow is already known the MARK feature of rte_flow has been used to provide the index directly as part of the packet meta-data. The work flow of the FlowTable application is like this:
The flow key used is a sorted 6-tuple because it reduces memory consumption and enable easy session tracking, hence I have one flow entry handling both upstream and downstream traffic. The drawback of a sorted key is that multi-threading cannot be lockless. To have a lockless access to the flow structure both the upstream and downstream queues must be handled by the same consumer and if RSS is not symmetric this cannot be guaranteed. Fortunately, the Napatech FPGA SmartNICs do support sorted/symmetric RSS, but it wasn’t the intent so show how to scale the flow table but rather focus on showing the benefit of HW acceleration.
The 6-tuple used is shown below and consist of IP-Version, IP protocol, the two IP addresses (src/dst) and the two L4 ports (src-port/dst-port).
/* Sorted tuple. ep[0] contain the lowest IP endpoint data */
struct flow_key {
  uint8_t ipv;          //!> IP version
  uint8_t ipproto;      //!> IP protocol
  struct {
    union {
      uint8_t ipv6[16]; //!> IP address
      uint32_t ipv4;
    };
    uint16_t port;      //!> L4 port
  } ep[2];
  uint8_t spare[26];    //!> To ensure the structure is 64 byte (min next power2 size) due to
                        //!> restrictions from rte_table_hash
};
Test setup
The setup I currently have access to is a Dell R730 with two Xeon E5-2690 CPUs a NT40E3-4-PTP Napatech NIC and a X710-DA2.
[root@dellr710ml ~]# lscpu
Architecture:          x86_64
CPU op-mode(s):        32-bit, 64-bit
Byte Order:            Little Endian
CPU(s):                48
On-line CPU(s) list:   0-47
Thread(s) per core:    2
Core(s) per socket:    12
Socket(s):             2
NUMA node(s):          2
Vendor ID:             GenuineIntel
CPU family:            6
Model:                 63
Model name:            Intel(R) Xeon(R) CPU E5-2690 v3 @ 2.60GHz
Stepping:              2
CPU MHz:               1199.960
BogoMIPS:              5206.00
Virtualization:        VT-x
L1d cache:             32K
L1i cache:             32K
L2 cache:              256K
L3 cache:              30720K
NUMA node0 CPU(s):     0,2,4,6,8,10,12,14,16,18,20,22,24,26,28,30,32,34,36,38,40,42,44,46
NUMA node1 CPU(s):     1,3,5,7,9,11,13,15,17,19,21,23,25,27,29,31,33,35,37,39,41,43,45,47
I have found that I can use one NUMA for testing and the other NUMA for traffic generation instead of using a separate server as traffic generator, the results are the same, so to make the setup easier I stick to one server. As traffic generator, since I need to generate multiple flows, I decided to look at Ciscos TRex traffic generator, which is a DPDK stateful traffic generator.
The Napatech DPDK support is work in progress so I decided to use the Napatech SmartNIC for TRex and show HW acceleration using rte_flow on the X710 via the FlowTable application.
Ciscos TRex stateful traffic generator (https://trex-tgn.cisco.com/)
The issue I ran into rather quickly was that the TRex needed special code for the supported NICS and therefore didn’t have support for the Napatech SmartNIC, so I had to create a “quick and dirty” implementation of TRex on top of the Napatech SmartNIC DPDK PMD. This wasn’t as straight forward as I expected because TRex use on PCIe IDs internally and use FDIR. The Napatech PMD is a virtual (–vdev) PMD, so I had to change TRex a bit around that and instead of FDIR use rte_flow, because Napatech doesn’t support FDIR, it’s not generic enough.
During the porting of TRex to the Napatech SmartNIC PMD, I discovered that DPDK and C++ are not the best of friends, I couldn’t include DPDK header files in the TRex C++ code so I had to create C wrappers for the DPDK calls and hide the C implementation somewhere inside DPDK…. Ugly! But again, it could just be that C++ and I are not the best of friends either.
Besides just making support for the Napatech SmartNIC PMD I also had to implement support for blacklisting devices because otherwise TRex would steal the X710 ports and I also had to fix a problem with –file-prefix which enable DPDK to run multiple independent instances.
Test results
Before starting any tests I need to ensure my system is configured optimally, so that the cores I use for the FlowTable on NUMA0 are completely isolated from the linux kernel scheduler and that they are running with the performance governor.
This is achieved by adding a special configuration to the boot-loader and enable the performance governor using the cpupower program. The boot-loader setup inspiration has come from this site: https://wiki.fd.io/view/VPP/How_To_Optimize_Performance_(System_Tuning)
If the performance governor is not chosen it is very difficult to control the outcome of the test because the powersaving mechanism will throttle the CPU frequency and try to keep is as low as possible to save power.
# Isolating CPUs and enabling 1G hugepages - Added to grub.cfg
isolcpus=8-23,32-47 nohz_full=8-23,32-47 rcu_nocbs=8-23,32-47 hugepagesz=1GB hugepages=16 default_hugepagesz=1GB
# Ensure performance governor - Issued as root in a shell
cpupower -c 8-23,32-47 frequency-set --governor performance
Before using the FlowTable application I used testpmd to provide an overview of the X710 capabilities. The X710 rte_flow is using the FDIR so I dumped the FDIR info and got that acceleration could be achieved on about 7000 flows per port but worst case only 512.
testpmd> show port fdir 0

######################## FDIR infos for port 0      ########################
MODE:   PERFECT
SUPPORTED FLOW TYPE:  ipv4-frag ipv4-tcp ipv4-udp ipv4-sctp ipv4-other ipv6-frag ipv6-tcp ipv6-udp ipv6-sctp ipv6-other l2_payload
FLEX PAYLOAD INFO:
max_len:       16          payload_limit: 480
payload_unit:  2           payload_seg:   3
bitmask_unit:  2           bitmask_num:   2
MASK:
vlan_tci: 0x0000, src_ipv4: 0x00000000, dst_ipv4: 0x00000000
src_port: 0x0000, dst_port: 0x0000
src_ipv6: 0x00000000,0x00000000,0x00000000,0x00000000
dst_ipv6: 0x00000000,0x00000000,0x00000000,0x00000000
FLEX PAYLOAD SRC OFFSET:
L2_PAYLOAD: 0   1   2   3   4   5   6   7   8   9   10  11  12  13  14  15
L3_PAYLOAD: 0   1   2   3   4   5   6   7   8   9   10  11  12  13  14  15
L4_PAYLOAD: 0   1   2   3   4   5   6   7   8   9   10  11  12  13  14  15
FLEX MASK CFG:
ipv4-udp:    00 00 00 00 00 00 00 00 00 00 00 00 00 00 00 00
ipv4-tcp:    00 00 00 00 00 00 00 00 00 00 00 00 00 00 00 00
ipv4-sctp:   00 00 00 00 00 00 00 00 00 00 00 00 00 00 00 00
ipv4-other:  00 00 00 00 00 00 00 00 00 00 00 00 00 00 00 00
ipv4-frag:   00 00 00 00 00 00 00 00 00 00 00 00 00 00 00 00
ipv6-udp:    00 00 00 00 00 00 00 00 00 00 00 00 00 00 00 00
ipv6-tcp:    00 00 00 00 00 00 00 00 00 00 00 00 00 00 00 00
ipv6-sctp:   00 00 00 00 00 00 00 00 00 00 00 00 00 00 00 00
ipv6-other:  00 00 00 00 00 00 00 00 00 00 00 00 00 00 00 00
ipv6-frag:   00 00 00 00 00 00 00 00 00 00 00 00 00 00 00 00
l2_payload:  00 00 00 00 00 00 00 00 00 00 00 00 00 00 00 00
guarant_count: 0           best_count:    0
guarant_space: 512         best_space:    7168
collision:     0           free:          0
maxhash:       0           maxlen:        0
add:           0           remove:        0
f_add:         0           f_remove:      0
############################################################################
testpmd>
Based on the above I decided to run with the cap2/imix_fast_1g.yaml traffic profile of TRex and run it 20 times faster than normal because that gives me 2x10Gbps in the stateless mode (apply -p to t-rex-64). That traffic profile creates 2×1194 UDP flows + 2 SCTP flows, the later used for latency measurements. The result of running with HW acceleration show, as expected, that CPU cycles are saved, which means less power is consumed and money is saved.
| Upstream Mbps | Downstream Mbps | CPU util | |
| No HW stateful | 9999.8 | 0.688 | 75 |
| With HW stateful | 9999.8 | 0.688 | 57 |
| No HW stateless | 8707.1 | 8414.7 | 100 |
| With HW stateless | 9999.8 | 9883.7 | 96 |
Note: The throughput is wire throughput hence including FCS (4B), interframe gap (12B) and preamble (8B).
The measurements above were run with the following commands, note the –file-prefix which is needed to run two independent DPDK applications, the FlowTable and t-rex-64:
# Run flowtable program
./examples/flowtable/build/flowtable -c 0x1500 --file-prefix fc --socket-mem 1024,1024

# Stateful TRex
./t-rex-64 -f cap2/imix_fast_1g.yaml -c 3 -m 20 -d 20  -l 1000 --blacklist-interfaces 04:00.0 04:00.1

# Stateless TRex
./t-rex-64 -f cap2/imix_fast_1g.yaml -c 3 -m 20 -d 20  -l 1000 --blacklist-interfaces 04:00.0 04:00.1 -p
Note that the –blacklist-interfaces 04:00.0 04.00.1 is new, it is something I had to add to the code to ensure that TRex didn’t steal the X710 ports and only used the –vdev ports specified in trex.yaml. Also note that the trex_cfg.yaml configuration contains prefix: trex_ntacc which is needed to run two independent DPDK applications on the same server.
- port_limit: 2
version: 2
interfaces: ["--vdev=eth_ntacc0,port=0", "--vdev=eth_ntacc1,port=1"]
prefix: trex_ntacc
port_info:
platform:
master_thread_id: 9
latency_thread_id: 11
dual_if:
- socket: 1
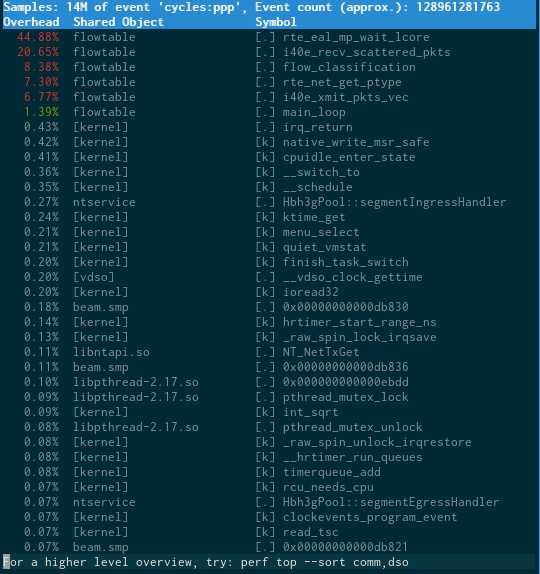
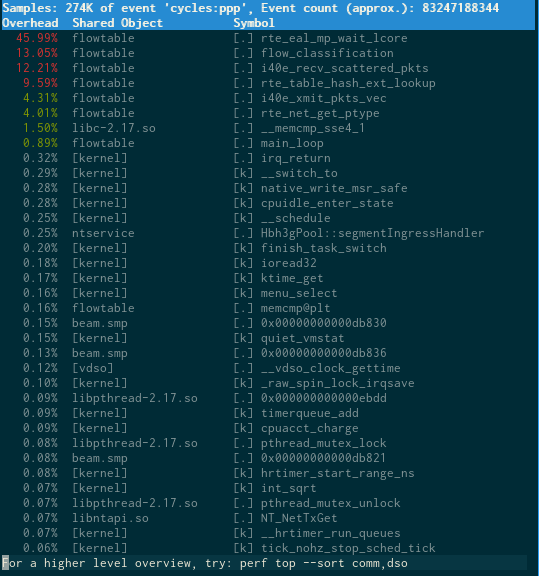
threads: [13,15,17,19,21,23]Apart from the TRex generated traffic I also ran a test with a TCP+SYN and a TCP+SYN+ACK packet to see what the performance would be if these two packets were sent at line-rate (10Gbps) with and without HW acceleration. The results are as expected the same as before but in both cases the CPU is the limiting factor, but with HW acceleration performance is more than 1.5x improved.
| Upstream Mbps | Downstream Mbps | CPU util | |
| Small TCP no HW | 3390,2 | 3390,6 | 100 |
| Small TCP with HW | 5491,7 | 5512,5 | 100 |
The two runs have been run with perf top to see where CPU cycles are spent. The rte_table_hash_ext_loopup funtion is quite CPU heavy and explains why HW acceleration improve performance, in this scenario.
rte_flow maturity
The generic flow API is quite new, so there will be room for improvement.
Programming a single flow took +11ms
One of the improvements I discovered was that X710 flow programming took +11ms, which is unusable in my context. It turned out that i40e_fdir.c had a fixed 10ms timeout before they check if the command was a success or not.
I changed that a bit as you can see below and instead of +11ms I now get an average programming time of 22usec with a max of 60usec.
There might be a very good reason why they wrote the code the way they did and it might be that my change doesn’t work in all cases but the FlowTable program I wrote doesn’t care if the programming command was a success or not since it will always fallback to SW handling if the acceleration is not applied.
diff --git a/dpdk-17.02/drivers/net/i40e/i40e_fdir.c b/dpdk-17.02/drivers/net/i40e/i40e_fdir.c
index 0700253..21c52af 100644
--- a/dpdk-17.02/drivers/net/i40e/i40e_fdir.c
+++ b/dpdk-17.02/drivers/net/i40e/i40e_fdir.c
@@ -1296,23 +1296,29 @@ i40e_fdir_filter_programming(struct i40e_pf *pf,
        rte_wmb();
        I40E_PCI_REG_WRITE(txq->qtx_tail, txq->tx_tail);

-       for (i = 0; i < I40E_FDIR_WAIT_COUNT; i++) {
-               rte_delay_us(I40E_FDIR_WAIT_INTERVAL_US);
+       for (i = 0; i < (I40E_FDIR_WAIT_COUNT * I40E_FDIR_WAIT_INTERVAL_US); i++) {
                if ((txdp->cmd_type_offset_bsz &
                                rte_cpu_to_le_64(I40E_TXD_QW1_DTYPE_MASK)) ==
                                rte_cpu_to_le_64(I40E_TX_DESC_DTYPE_DESC_DONE))
                        break;
+               rte_delay_us(1);
        }
-       if (i >= I40E_FDIR_WAIT_COUNT) {
+       if (i >= (I40E_FDIR_WAIT_COUNT * I40E_FDIR_WAIT_INTERVAL_US)) {
                PMD_DRV_LOG(ERR, "Failed to program FDIR filter:"
                            " time out to get DD on tx queue.");
                return -ETIMEDOUT;
        }
        /* totally delay 10 ms to check programming status*/
-       rte_delay_us((I40E_FDIR_WAIT_COUNT - i) * I40E_FDIR_WAIT_INTERVAL_US);
+  uint32_t w;
+       for (w = 0; w < (I40E_FDIR_WAIT_COUNT * I40E_FDIR_WAIT_INTERVAL_US); w++) {
+               if (i40e_check_fdir_programming_status(rxq) >= 0) {
+                       break;
+               }
+               rte_delay_us(1);
+       }
        if (i40e_check_fdir_programming_status(rxq) < 0) {
                PMD_DRV_LOG(ERR, "Failed to program FDIR filter:"
-                           " programming status reported.");
+                                   " programming status reported.");
                return -ENOSYS;
        }
Unstability with rte_flow and X710
Sadly, I often ended up in a situation where only a server reboot would get the X710 out of an error state when I exercise the rte_flow. I have not found any pattern but all of the sudden rte_flow doesn’t work on the X710 and there are no errors or anything, the flow index is simply not returned nor is the bit in mbuf->ol_flags indicating that HW acceleration is activated set.
HW acceleration does pay off
The tests clearly show that there is a significant performance boost if one have access to a NIC with flow tables, but there are two downsides of using HW acceleration via rte_flow:
- Limited resource
The amount of flow that can be programmed into the NIC is very limited compared to the table maintained in SW.
The X710 has approx. 16k entries, so in order to get the biggest improvement some metering must be done to ensure that acceleration is chosen only on the busiest flows. One naive approach could be to just measure the packets per second across a time period and if it hits a certain threshold acceleration will be applied using HW. - Programming time
Programming HW take a while, even with the optimization I made to X710 it take in the range of micro-seconds, which is why I in my application had to create a dedicated handler that could write the flows to HW asynchronous from the main loop.
I personally hope that DPDK NIC vendors are encouraged to support rte_flow and that SW developers use rte_flow to get HW acceleration built into their applications, it does make a difference!
Related Posts